How it works
A forward model predicts the measurements a proposed underground arrangement would produce. Inversion adjusts a model so its predictions better match the observations. Computing power lets us work with larger problems and test more alternatives. Geological interpretation then asks which explanations are credible and useful for the project.
Where it is commonly used
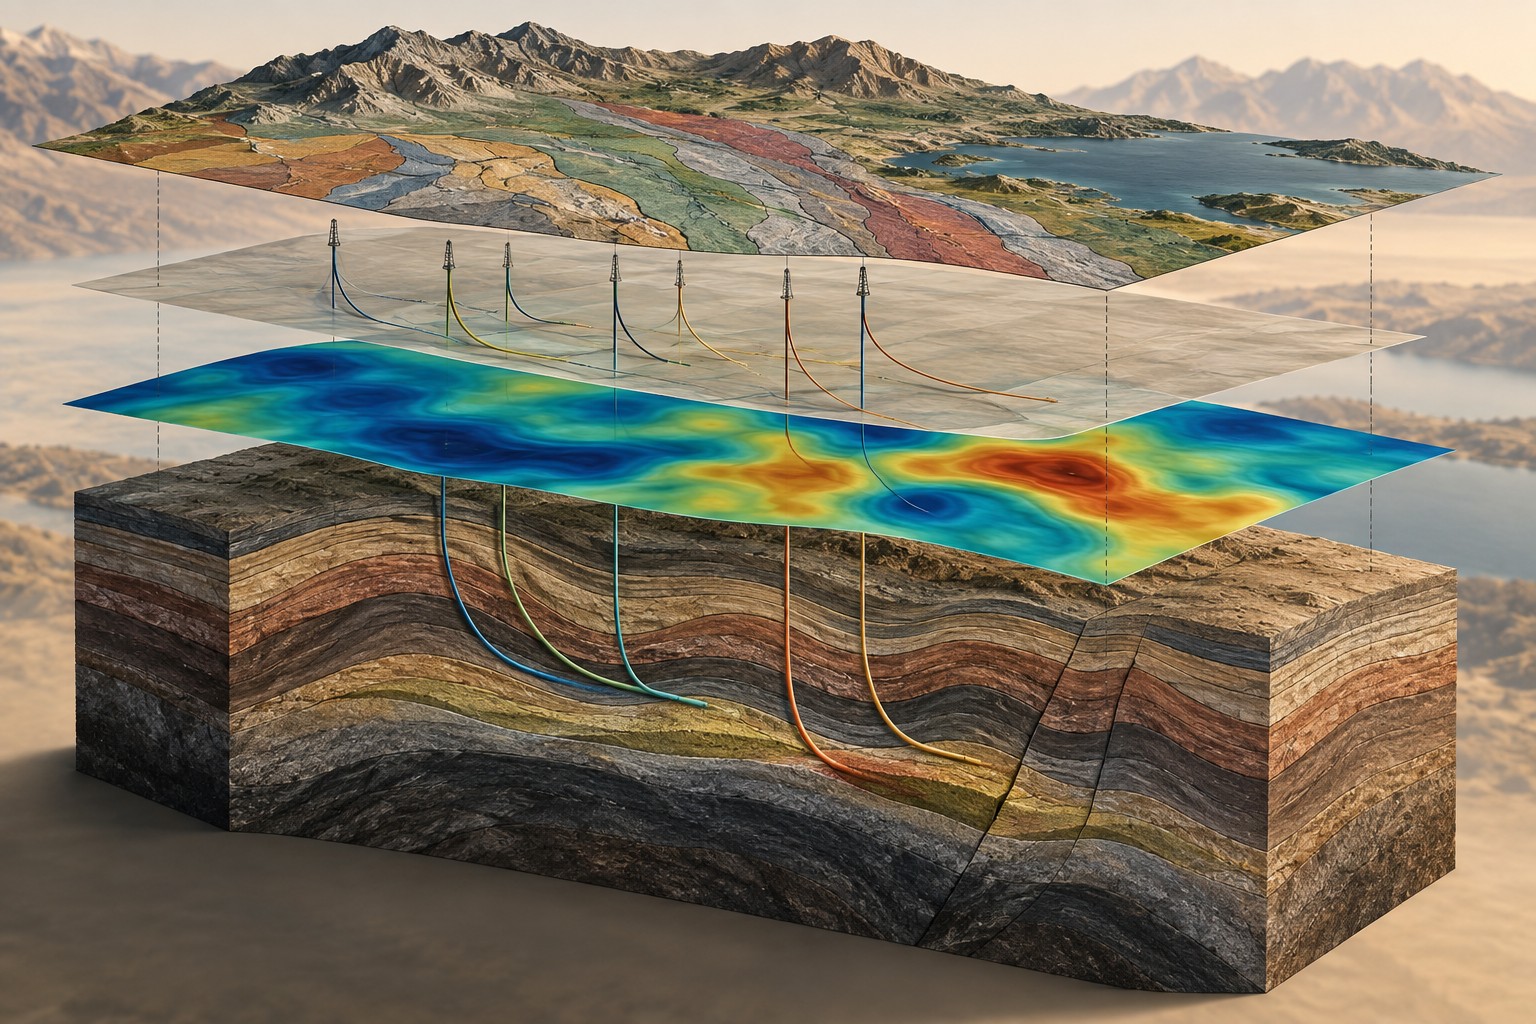
Integrated modelling connects MT, AMT, TDEM, gravity, magnetics, geology, terrain and available well or seismic information. It supports resource screening, target prioritization, uncertainty assessment and Field Development Planning. The combination is selected for the question; every dataset need not enter the same mathematical inversion.
Why use this approach?
A shared spatial framework exposes gaps and disagreements that can be missed in separate reports. Larger computations can support more detailed meshes or additional sensitivity tests where the data justify them. The practical benefit is the ability to examine alternatives and communicate why a recommendation follows from the evidence.
What it cannot tell you on its own
More computing power cannot create information that was never measured. A finely divided model is not necessarily highly resolved. Choices about smoothing, starting assumptions, noise and geological constraints affect the result. Dwell explains these limits rather than claiming guaranteed superiority over every other provider.
From data to interpretation
We check data provenance, licences, coordinates, units and uncertainty. After processing and modelling, we compare predictions with observations and test important assumptions. Aline leads technical review; Javier coordinates the models, maps and report, drawing on focused specialist contributions.
What you receive
An integrated interpretation; maps and sections; model files as agreed; a printable report; an HTML 3D Atlas where scoped; documented inputs and assumptions; confidence statements and prioritized next actions. The Atlas is a project deliverable, not a claim that this marketing site contains live client data.
How it compares & fits with other methods
A standalone survey answers a particular physical-property question. Integration connects those answers with geology and direct observations. It may involve side-by-side interpretation, constrained modelling or joint inversion where technically suitable; these approaches are not interchangeable.
An example decision
Electrical and gravity models suggest different basin geometries. Instead of averaging them, we check data quality and rock-property assumptions, test plausible alternatives, and identify the additional well or survey evidence that would most efficiently distinguish them.
Examples describe possible assignments, not completed Dwell projects. Equipment, acquisition partners, coverage and deliverables are agreed in the proposal.
Technical background ↗