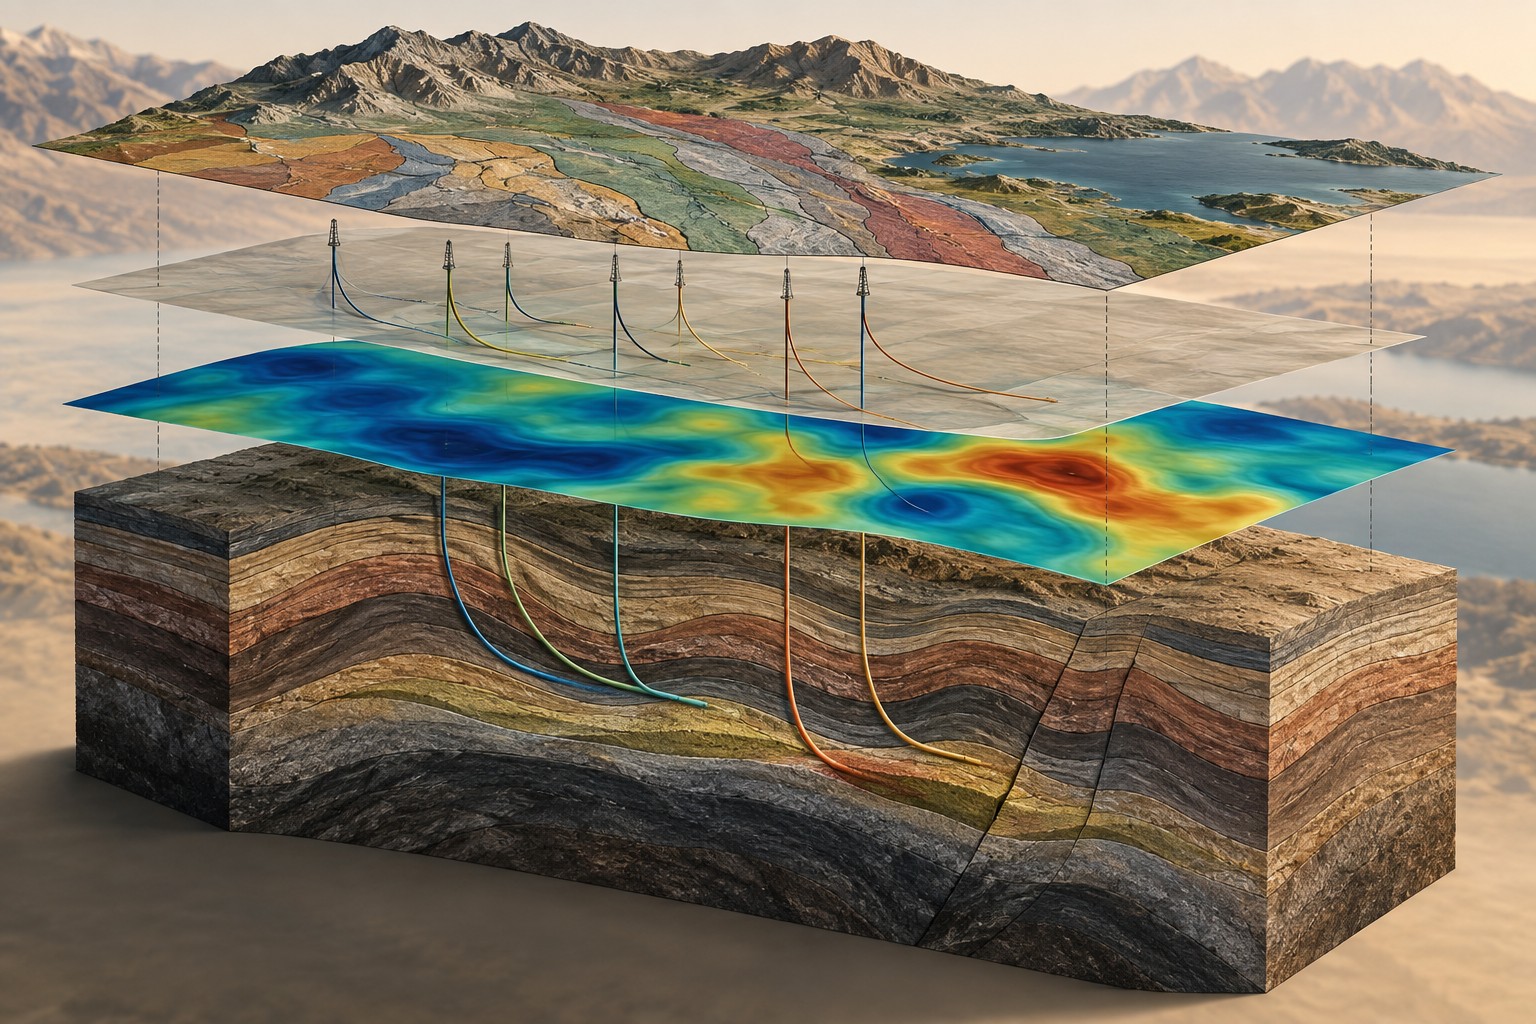
How it works
A gradient describes how quickly a measurement changes over distance. Some instruments measure this difference directly using separated sensors. Gradients can also be calculated from suitable survey data. These are different products: a calculated derivative is not a new independent measurement and cannot recover detail absent from the original survey.
Where it is commonly used
Gradient information can help investigate contacts, faults, intrusive margins and other features that produce measurable density or magnetic contrasts. The value depends on source depth, sensor arrangement, survey spacing and noise. We use it to refine geological questions rather than to promise sharper images everywhere.
Why use this approach?
Gradients can make subtle boundaries easier to examine and provide additional constraints on the shape of a source. They are most useful when interpreted alongside the original field, geological mapping and other measurements, so the emphasis on edges does not obscure the broader picture.
What it cannot tell you on its own
Differentiation can amplify noise. Deeper sources may have weak gradients, and shallow or cultural features can dominate. Gravity gradients still reflect density; magnetic gradients still reflect magnetization. Neither establishes resource quality or proves that an interpreted edge is a fault.
From data to interpretation
Dwell can evaluate public or licensed gradient datasets and assess whether their acquisition and processing suit the project. We review measured versus calculated products, units, direction, spacing and uncertainty. Any new specialist acquisition is explicitly scoped with the appropriate provider.
What you receive
Gradient maps and profiles; explanation of the measured or derived quantities; interpreted boundaries; comparison with original fields; confidence and follow-up priorities.
How it compares & fits with other methods
Conventional gravity or magnetic maps preserve broad regional trends. Gradient products emphasize spatial change. They work together; the most visually striking product is not automatically the most reliable guide to geology.
An example decision
A basin model contains a possible steep margin. A gravity-gradient dataset may help assess its lateral position, while wells or seismic constrain depth and geometry. We test alternative density distributions before treating the margin as a development boundary.
Examples describe possible assignments, not completed Dwell projects. Equipment, acquisition partners, coverage and deliverables are agreed in the proposal.
Technical background ↗